By Thomas AxelssonPublished 4 min read
Sustainate works out a flight's CO₂ from the distance flown, with a routing uplift of 1.08, and a train's, bus's or ferry's from energy and emission factors per passenger-kilometre. Two worked examples show the effect: the London to Paris route saves 42 kg of CO₂ (95%) against the flight, and the Stockholm to Oslo route saves 49 kg (92%).
How do we calculate the CO₂ of a flight?
It starts with the great-circle distance, the straight line between the two cities. Real flight paths are longer than that line, so Sustainate multiplies it by a routing uplift of 1.08 and then applies an emission factor to the flown distance.
There are two factors. The domestic factor is 0.22928 kg of CO₂ per passenger-kilometre. The short-haul factor is 0.12786 kg per passenger-kilometre, and it applies to flights below 3700 km. Both come from the UK DESNZ greenhouse gas conversion factors.
The flight's time is built the same way. Door-to-door time starts with the time in the air and adds 2.5 hours at the airports, 1.5 hours for the transfer into the city and a taxi and climb allowance of 0.5 hours.
Here are the steps with round figures, so you can follow the arithmetic. The same three steps apply to every flight, and only the distance changes. A great-circle distance of 600 km becomes a flown distance of 648 km, which rates at 77 kg of CO₂. The air time is 1.31 hours, and the door-to-door time comes to 5.31 hours.
Flights are treated as the benchmark. Every route page compares its train, bus or ferry figure with the flight figure worked out this way, which is how the saved kilograms and percentages are produced.
How do we calculate the CO₂ of a train, bus or ferry?
Ground and sea transport are counted per passenger-kilometre, but each mode has its own basis. The table sets out the factors.
| mode | factor | basis |
|---|---|---|
| train | 0.05 kWh | energy per passenger-kilometre, times the grid factor |
| bus | 0.027 kg | CO₂ per passenger-kilometre |
| ferry | 0.019 kg | CO₂ per passenger-kilometre |
Bus and ferry are simple: their factors are set directly in kilograms per passenger-kilometre, so they do not depend on where the vehicle runs. A train is different. Its figure is an amount of energy, and only the grid factor, in kilograms per kilowatt-hour, turns it into kilograms of CO₂.
Why does the electricity grid matter for trains?
Because a train runs on electricity, and its emissions depend on how that electricity is made. Sustainate uses a default grid factor of 0.2 kg of CO₂ per kWh, and the factors it works with range from 0.03 kg to 0.65 kg per kWh.
That spread is why the country matters, and why the same train can carry a different figure depending on where it runs. A train on a low-carbon grid and a train on a coal-heavy grid can use the same energy per passenger-kilometre and still produce very different amounts of CO₂.
Bus and ferry get no grid factor. Their figures are fixed per passenger-kilometre, which makes a bus or ferry route simpler to estimate than a train route, but also means the figure cannot reflect a cleaner or dirtier grid.
What does a worked example look like?
The two examples run the same method on different trips. The table shows the figures side by side.
| item | London to Paris | Stockholm to Oslo |
|---|---|---|
| great-circle distance | 344 km | 416 km |
| train time | 2h 18m | 5h 30m |
| train CO₂ | 2 kg | 4 kg |
| flight distance | 371 km | 450 km |
| flight CO₂ | 44 kg | 53 kg |
| flight door to door | 4h 58m | 5h 04m |
| CO₂ saved | 42 kg (95%) | 49 kg (92%) |
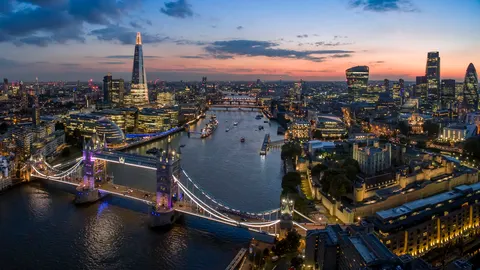
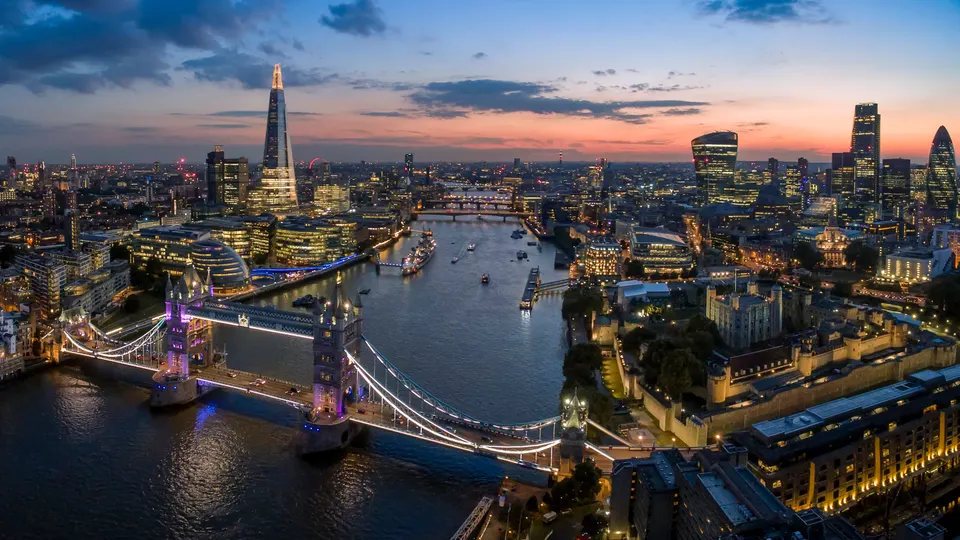
London to Paris is a clear win. Eurostar runs the train with no changes in 2h 18m, while the flight takes 4h 58m door to door, so the train is 2h 40m faster. It also saves 42 kg of CO₂, which is 95% of the flight's figure.
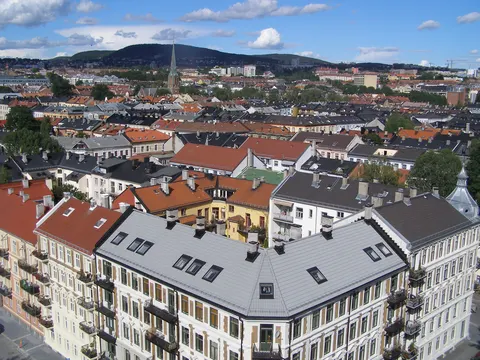
Stockholm to Oslo tells a different story. SJ runs the train with no changes, but it takes 5h 30m against 5h 04m door to door for the flight, so the train is 26 minutes slower. It still saves 49 kg of CO₂, or 92%. That is the usual trade-off on a longer rail trip: the carbon saving is large, and the cost is time.
The two cases show that the CO₂ saving does not depend on the time saving. In one the train wins on both counts, and in the other it wins only on carbon, so you need both figures to decide. You can browse the routes on the routes page, and the cities have their own Stockholm and Oslo pages.
What are the limits of these estimates?
They are estimates, not measurements of one trip, and it is worth knowing where they are blunt. The factors are averages per passenger-kilometre, so they cannot know which aircraft flew your route or how full the train was. The routing uplift of 1.08 is a fixed allowance for the longer path a flight takes.
The grid factor is a country-level average, so a train on a particular day may produce more or less CO₂ than the figure shows. The numbers are good enough to compare options, but they are no substitute for an operator's own emissions report.
The route data has limits as well. A route guide covers trips of at least 150 km and up to 16 hours, or up to 20 hours for a night train. The route search uses one hour of penalty time for each change when it ranks options, while journey totals add a fixed allowance for each change. It caps travel time at 16 hours and allows ferry legs of up to 36 hours.